Monitoring Varnish with Splunk
Prerequisites
To follow along, you will need at least the following:
- A server with
rootaccess and Varnish installed on it - A server that will be dedicated for the Splunk indexer
If you don’t already have a Splunk Enterprise account, you can sign up for a 60-day trial account.
Installation
Splunk forwarders consume data and send it to an indexer. The Splunk indexer processes the incoming data from the forwarder for indexing, which consolidates, stores, and makes the data available for searching.
In this tutorial, we are working with a Varnish server that stores access logs in the universal NCSA logging format under /var/log/varnish/varnishncsa.log. This log file is created by the varnishncsa program, which is run by the corresponding systemd service on your Varnish server.
varnishncsa systemd service is enabled on your Varnish server.
If you haven’t done that yet, please follow the instructions in the varnishncsa tutorial.We will configure a Splunk forwarder on the Varnish host to ensure the log entries in /var/log/varnish/varnishncsa.log end up in Splunk Enterprise.
Splunk Universal Forwarder
Once your account on Splunk has been created and verified, you’ll need to download and install the Splunk Universal Forwarder on the server where Varnish is installed.
Step 1: Download the Splunk Universal Forwarder
Go to the Splunk Universal Forwarder Downloads page and choose your OS and the appropriate installation package
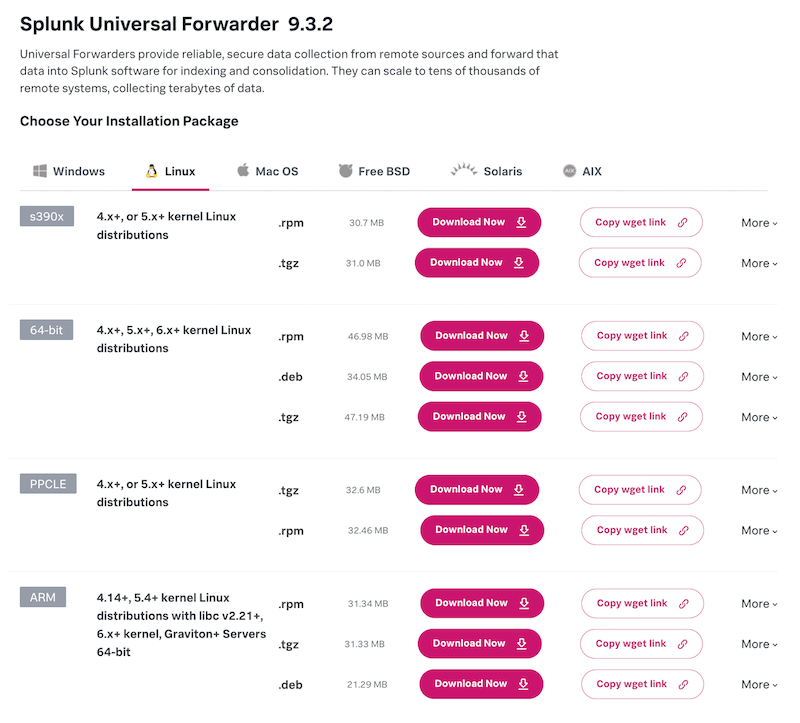
You can optionally copy the wget link to download the package directly on your server:
wget -O splunkforwarder-9.3.2-d8bb32809498.x86_64.rpm "<link/from/download/page>"
There are download options available for various architectures and various distributions.
Step 2: Install the Splunk Universal Forwarder
Follow the installation instructions specific to your operating system. For example, on Red Hat-based systems, you can run the following command to install the downloaded package:
sudo rpm -ivh splunkforwarder-9.3.2-d8bb32809498.x86_64.rpm
On Debian or Ubuntu, the install command would look like this:
sudo dpkg -i splunkforwarder-9.3.2-d8bb32809498-linux-2.6-amd64.deb
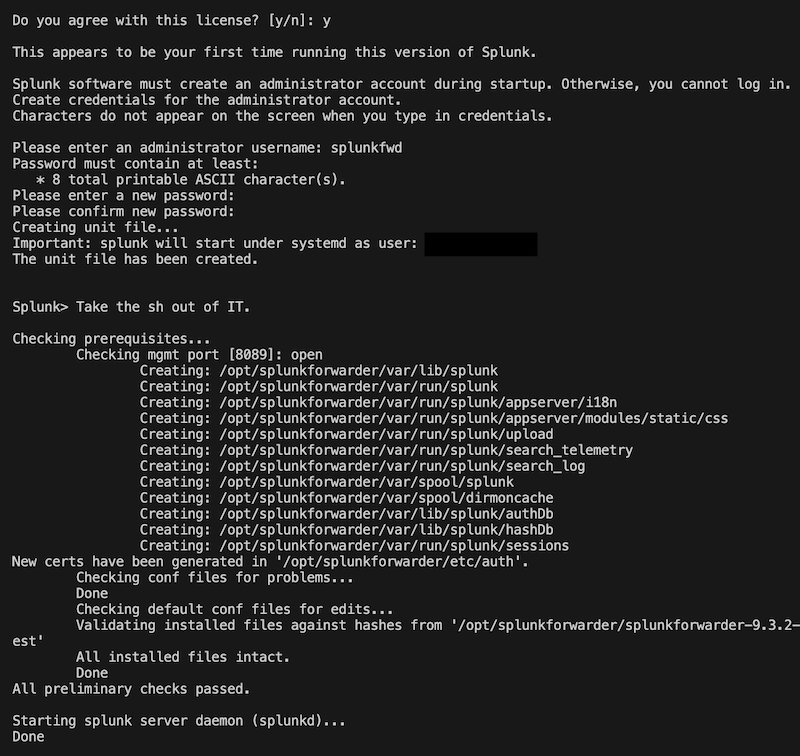
By default, the Splunk Universal Forwarder is installed in /opt/splunkforwarder directory. Start
the forwarder and follow the prompts for accepting the license agreement:
sudo /opt/splunkforwarder/bin/splunk start
Splunk Indexer
The Splunk Indexer, which is part of the Splunk Enterprise package, has to be installed on a separate server, other than the one that has Varnish and Splunk Universal Forwarder running.
To get started with the Splunk Indexer, run the following commands.
Step 1: Download the Splunk Enterprise
Go to the Splunk Enterprise Downloads page and choose your OS and installation package
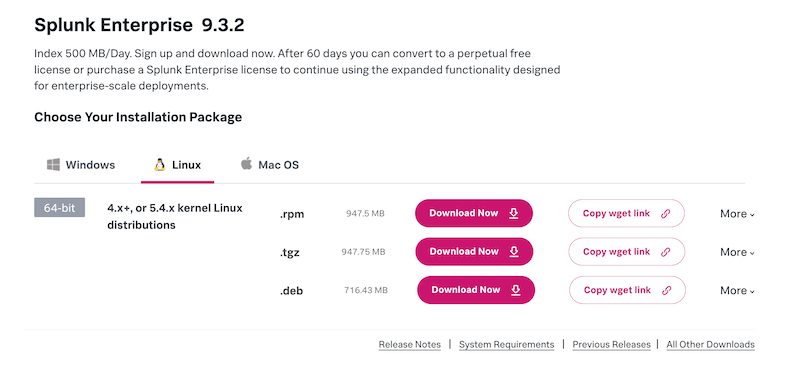
You can optionally copy the wget link to download the package directly on your server:
wget -O splunk-9.3.2-d8bb32809498.x86_64.rpm "<link/from/download/page>"
Step 2: Install the Splunk Enterprise
Follow the installation instructions specific to your operating system. For example, on Red Hat-based systems, you can run the following command to install the downloaded package:
sudo rpm -ivh splunk-9.3.2-d8bb32809498.x86_64.rpm
On Debian or Ubuntu, the install command would look like this:
sudo dpkg -i splunk-9.3.2-d8bb32809498-linux-2.6-amd64.deb
By default, the Splunk Universal Forwarder is installed in /opt/splunk directory. Start the service
and follow the prompts for accepting the license agreement.
sudo /opt/splunk/bin/splunk start
Once successful, the address for your Splunk web interface will be displayed:
Waiting for web server at http://127.0.0.1:8000 to be available.......... Done


If you get stuck, we're here to help.
Look for answers here: http://docs.splunk.com

The Splunk web interface is at http://123.123.123.123:8000
Take note of the address as this is what you will access on your browser to log in to your Splunk web interface later.
Splunk Web Interface
Copy the URL of the Splunk web interface that was provided when you started Splunk Enterprise and paste it into your browser’s address bar to access the web interface:
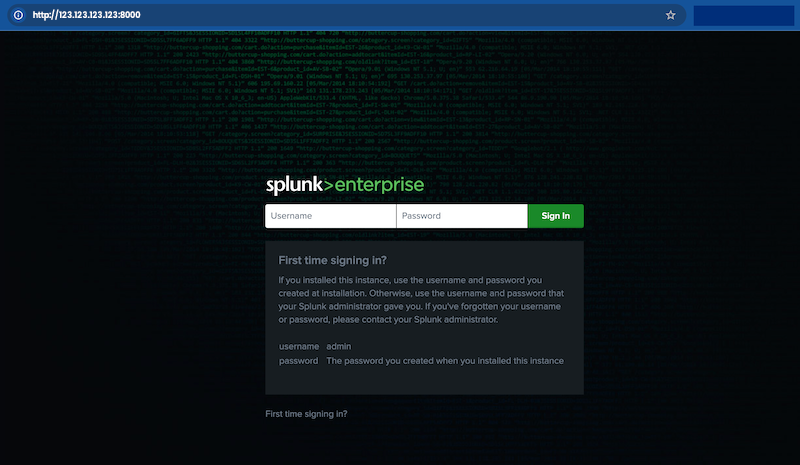
Login using the admin username and password that you have set when you started Splunk Enterprise on your terminal the first time.

Access the Splunk web interface through an SSH tunnel
If you are running Splunk Enterprise on a remote server (or virtual machine), and you are unable to directly access the web interface using the provided address on your local browser, you may encounter an error page that says, “This site can’t be reached.”
To address this, you can run the following command on your local terminal ssh -L <port>:127.0.0.1:8000 name@<remote server's public IP>,
where:
<port>: the local port on your machine that you will connect to (e.g.8083)127.0.0.1:8000: the Splunk web interface running on the remote server’slocalhostYou might have seen this displayed as “Waiting for web server at (…) to be available."
name@<remote server's public IP>: refers to your SSH login credentials
Here’s an example where we forward localhost:8000 on server 123.123.123.123 to the local system’s port 8083:
ssh -L 8083:127.0.0.1:8000 root@123.123.123.123
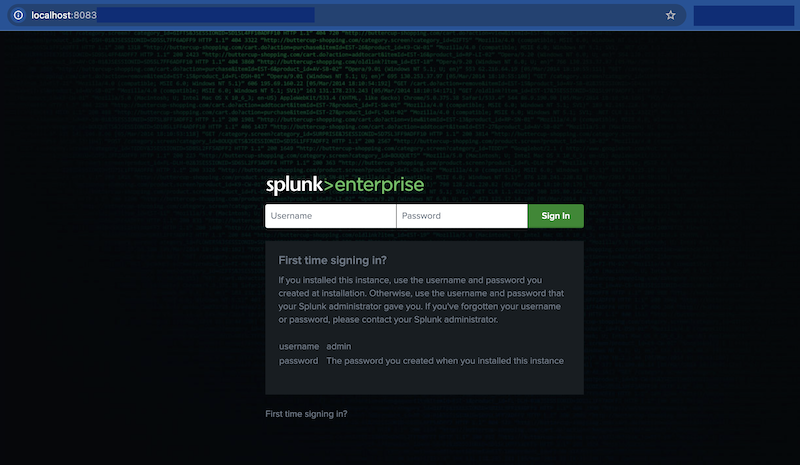
On your local web browser, run localhost:8083 (or whichever port you specified) to access the Splunk web interface:
Configuration
Enable Splunk indexer to be a receiver
You can configure the Splunk indexer to receive data from the forwarder using the web interface.
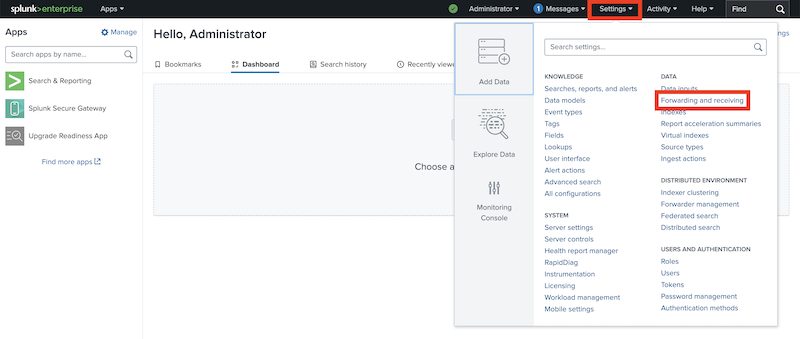
Login to the Splunk web interface by following our guide and go to Settings > Forwarding and receiving to set a receiver port:
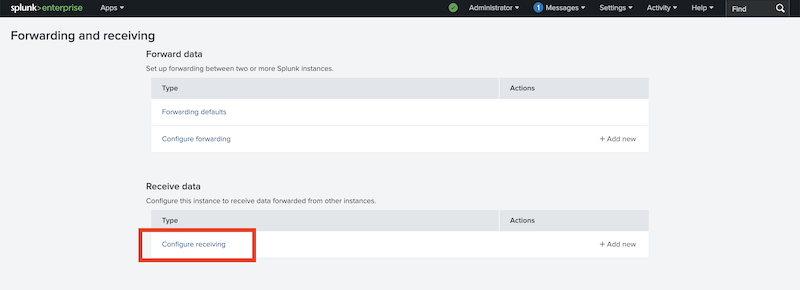
And then click Configuring receiving:
Press the New Receiving Port button:

The conventional receiver port configured on indexers is 9997. Add the port number and press the save button:

You can also configure this using the command line or using a configuration file. This is described in more detail in the Splunk documentation.
Configure the universal forwarder to connect to a receiving indexer
On the Splunk Forwarder server’s terminal, run the command using the port that you configured in the Splunk web interface.
Replace <splunk-enterprise-ip> with your Splunk Enterprise server’s IP address.
sudo /opt/splunkforwarder/bin/splunk add forward-server <splunk-enterprise-ip>:9997
---
Added forwarding to: <splunk-enterprise-ip>:9997.
To verify if you have successfully added the forward server, you can run the following command:
sudo /opt/splunkforwarder/bin/splunk list forward-server
---
Active forwards:
        <splunk-enterprise-ip>:9997
Configured but inactive forwards:
        None
Configure the forwarder to monitor varnishncsa logs
varnishncsa systemd service is enabled on your Varnish server (where Splunk Universal Forwarder is also running).
If you haven’t done that yet, please follow the instructions in the varnishncsa tutorial.On the Splunk Forwarder server’s terminal, run the command that enables that data input:
sudo /opt/splunkforwarder/bin/splunk add monitor /var/log/varnish/varnishncsa.log
To verify if you have successfully added varnishncsa.log in the list of data to be monitored by Splunk, you can run the following command:
sudo /opt/splunkforwarder/bin/splunk list monitor
The expected result would be like the following:
Monitored Files:
    $SPLUNK_HOME/etc/splunk.version
    /var/log/varnish/varnishncsa.log
This is described in more detail in the Splunk documentation.
Checking if it all works
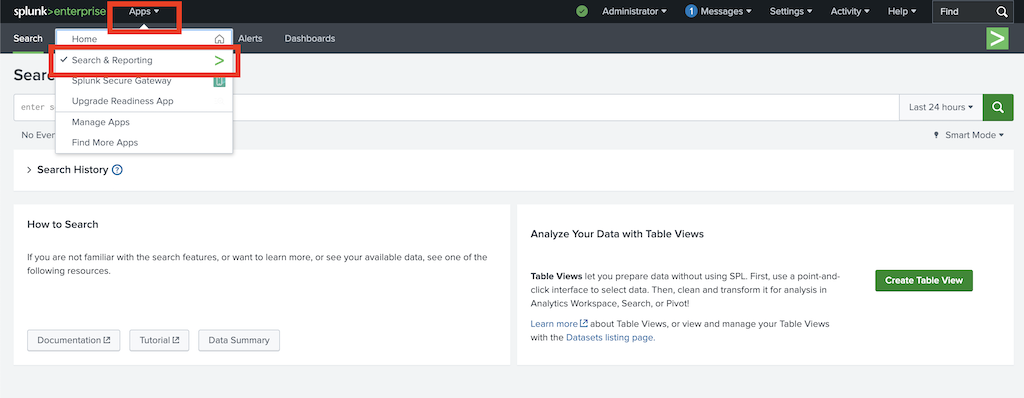
In the Splunk web interface, go to Apps > Search and Reporting:
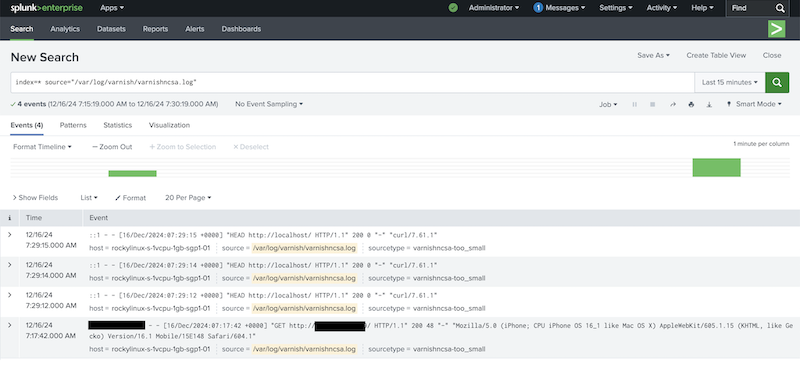
Search for data and adjust the search query to only include varnishncsa.log:
index=* source="/var/log/varnish/varnishncsa.log"
The output should contain the relevant log entries:
