Monitoring with Prometheus, Loki & Grafana
Have you ever wondered how this Grafana thing works? What Prometheus is, or if there’s more to Loki than Tom Hiddleston? If so, keep on reading, we are going to explore a tiny deployment that sets up those components and integrates them with varnish.
As Grafana and prometeus are two of the quickest names to come to mind when talking about monitoring, it’s interesting to know at least one way to deploy them, which will explore together here.
If you are in a hurry, you can check the code on GitHub, or jump directly to each subsection in the table of contents.
Overview
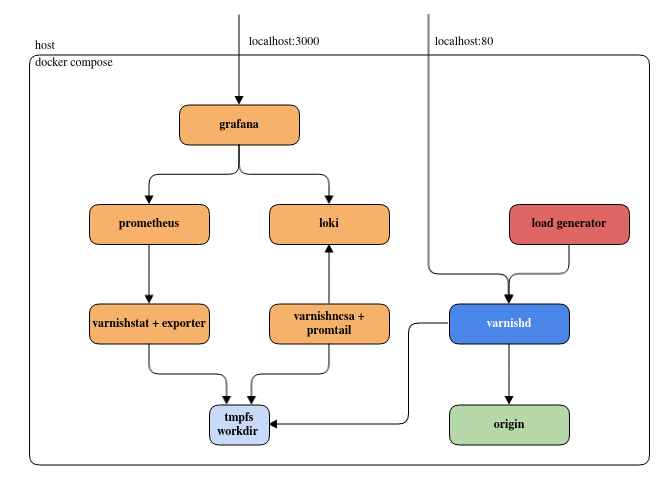
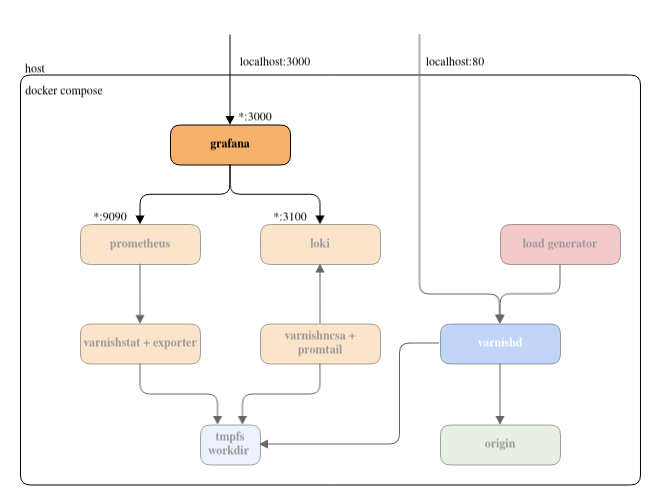
We are going to use containers to spin up:
- A varnish server
- An origin
- A load generator to create some artificial traffic
- A Prometheus server to collect metrics, and a Loki one for logs
- Exporters to push varnish data to Prometheus/Loki
- A Grafana instance to visualize the exported data
As the title infers, this will be a simple setup to help understand the various moving parts involved, and this should not be taken straight into production. Some details have been omitted or simplified for the sake of clarity, for example:
- Access management
- Network security
- Volume permissions
- Dashboards structures
- Alerting
- Relevant metrics to monitor
Similarly, Grafana, Prometheus and Loki are infinitely configurable tools and choices had to be made to avoid going to deep into rabbit holes. In short: the configuration is just complex enough to make things work and/or make a point, do not expect manual pages here.
Requirements
The setup relies entirely on docker compose, so make sure you have a relatively recent version installed. And of course you will need git to clone the repository.
Getting started
First, let’s get the code:
git clone https://github.com/varnish/toolbox.git
cd toolbox/docker-compose-examples/grafana-monitoring
There should be a bunch of files in this directory, the two most important ones being docker-compose.yaml and .env.
The presence of docker-compose.yaml means we can call
docker compose up
and Docker will spin up the containers described in the yaml file (using values found in .env). Running this should start filling your screen, starting with something like this:
[+] Running 9/9
 ✔ Network docker-compose_default             Created                                                                                                                                                                                                                                                                    0.1s
 ✔ Container docker-compose-promtail-1        Created                                                                                                                                                                                                                                                                    0.2s
 ✔ Container docker-compose-grafana-1         Created                                                                                                                                                                                                                                                                    0.2s
 ✔ Container docker-compose-loki-1            Created                                                                                                                                                                                                                                                                    0.2s
 ✔ Container docker-compose-prometheus-1      Created                                                                                                                                                                                                                                                                    0.2s
 ✔ Container docker-compose-origin-1          Created                                                                                                                                                                                                                                                                    0.1s
 ✔ Container docker-compose-varnish-1         Created                                                                                                                                                                                                                                                                    0.1s
 ✔ Container docker-compose-exporter-1        Created                                                                                                                                                                                                                                                                    0.1s
 ✔ Container docker-compose-load_generator-1  Created                                                                                                                                                                                                                                                                    0.1s
Attaching to exporter-1, grafana-1, load_generator-1, loki-1, origin-1, prometheus-1, promtail-1, varnish-1
promtail-1        | level=info ts=2024-01-17T23:12:31.589369204Z caller=promtail.go:133 msg="Reloading configuration file" md5sum=337a112dd5f6434312be86c5e0c8cdf9
promtail-1        | level=info ts=2024-01-17T23:12:31.58999493Z caller=server.go:334 http=[::]:9080 grpc=[::]:39375 msg="server listening on addresses"
promtail-1        | level=info ts=2024-01-17T23:12:31.590194311Z caller=main.go:174 msg="Starting Promtail" version="(version=2.8.7, branch=HEAD, revision=1dfdc432c)"
promtail-1        | level=warn ts=2024-01-17T23:12:31.59022805Z caller=promtail.go:265 msg="enable watchConfig"
prometheus-1      | ts=2024-01-17T23:12:31.734Z caller=main.go:539 level=info msg="No time or size retention was set so using the default time retention" duration=15d
prometheus-1      | ts=2024-01-17T23:12:31.734Z caller=main.go:583 level=info msg="Starting Prometheus Server" mode=server version="(version=2.48.1, branch=HEAD, revision=63894216648f0d6be310c9d16fb48293c45c9310)"
prometheus-1      | ts=2024-01-17T23:12:31.734Z caller=main.go:588 level=info build_context="(go=go1.21.5, platform=linux/amd64, user=root@71f108ff5632, date=20231208-23:33:22, tags=netgo,builtinassets,stringlabels)"
prometheus-1      | ts=2024-01-17T23:12:31.734Z caller=main.go:589 level=info host_details="(Linux 6.6.8-arch1-1 #1 SMP PREEMPT_DYNAMIC Thu, 21 Dec 2023 19:01:01 +0000 x86_64 11171d61dfae (none))"
prometheus-1      | ts=2024-01-17T23:12:31.734Z caller=main.go:590 level=info fd_limits="(soft=1073741816, hard=1073741816)"
prometheus-1      | ts=2024-01-17T23:12:31.734Z caller=main.go:591 level=info vm_limits="(soft=unlimited, hard=unlimited)"
prometheus-1      | ts=2024-01-17T23:12:31.735Z caller=web.go:566 level=info component=web msg="Start listening for connections" address=0.0.0.0:9090
And you’ll see containers happily push its logs, each with a different header and color. You’ll be able to shut off everything with a simple Ctrl+C, but not now.
Instead, now, you are going head over to http://localhost:3000/ and a active dashboard should greet you:
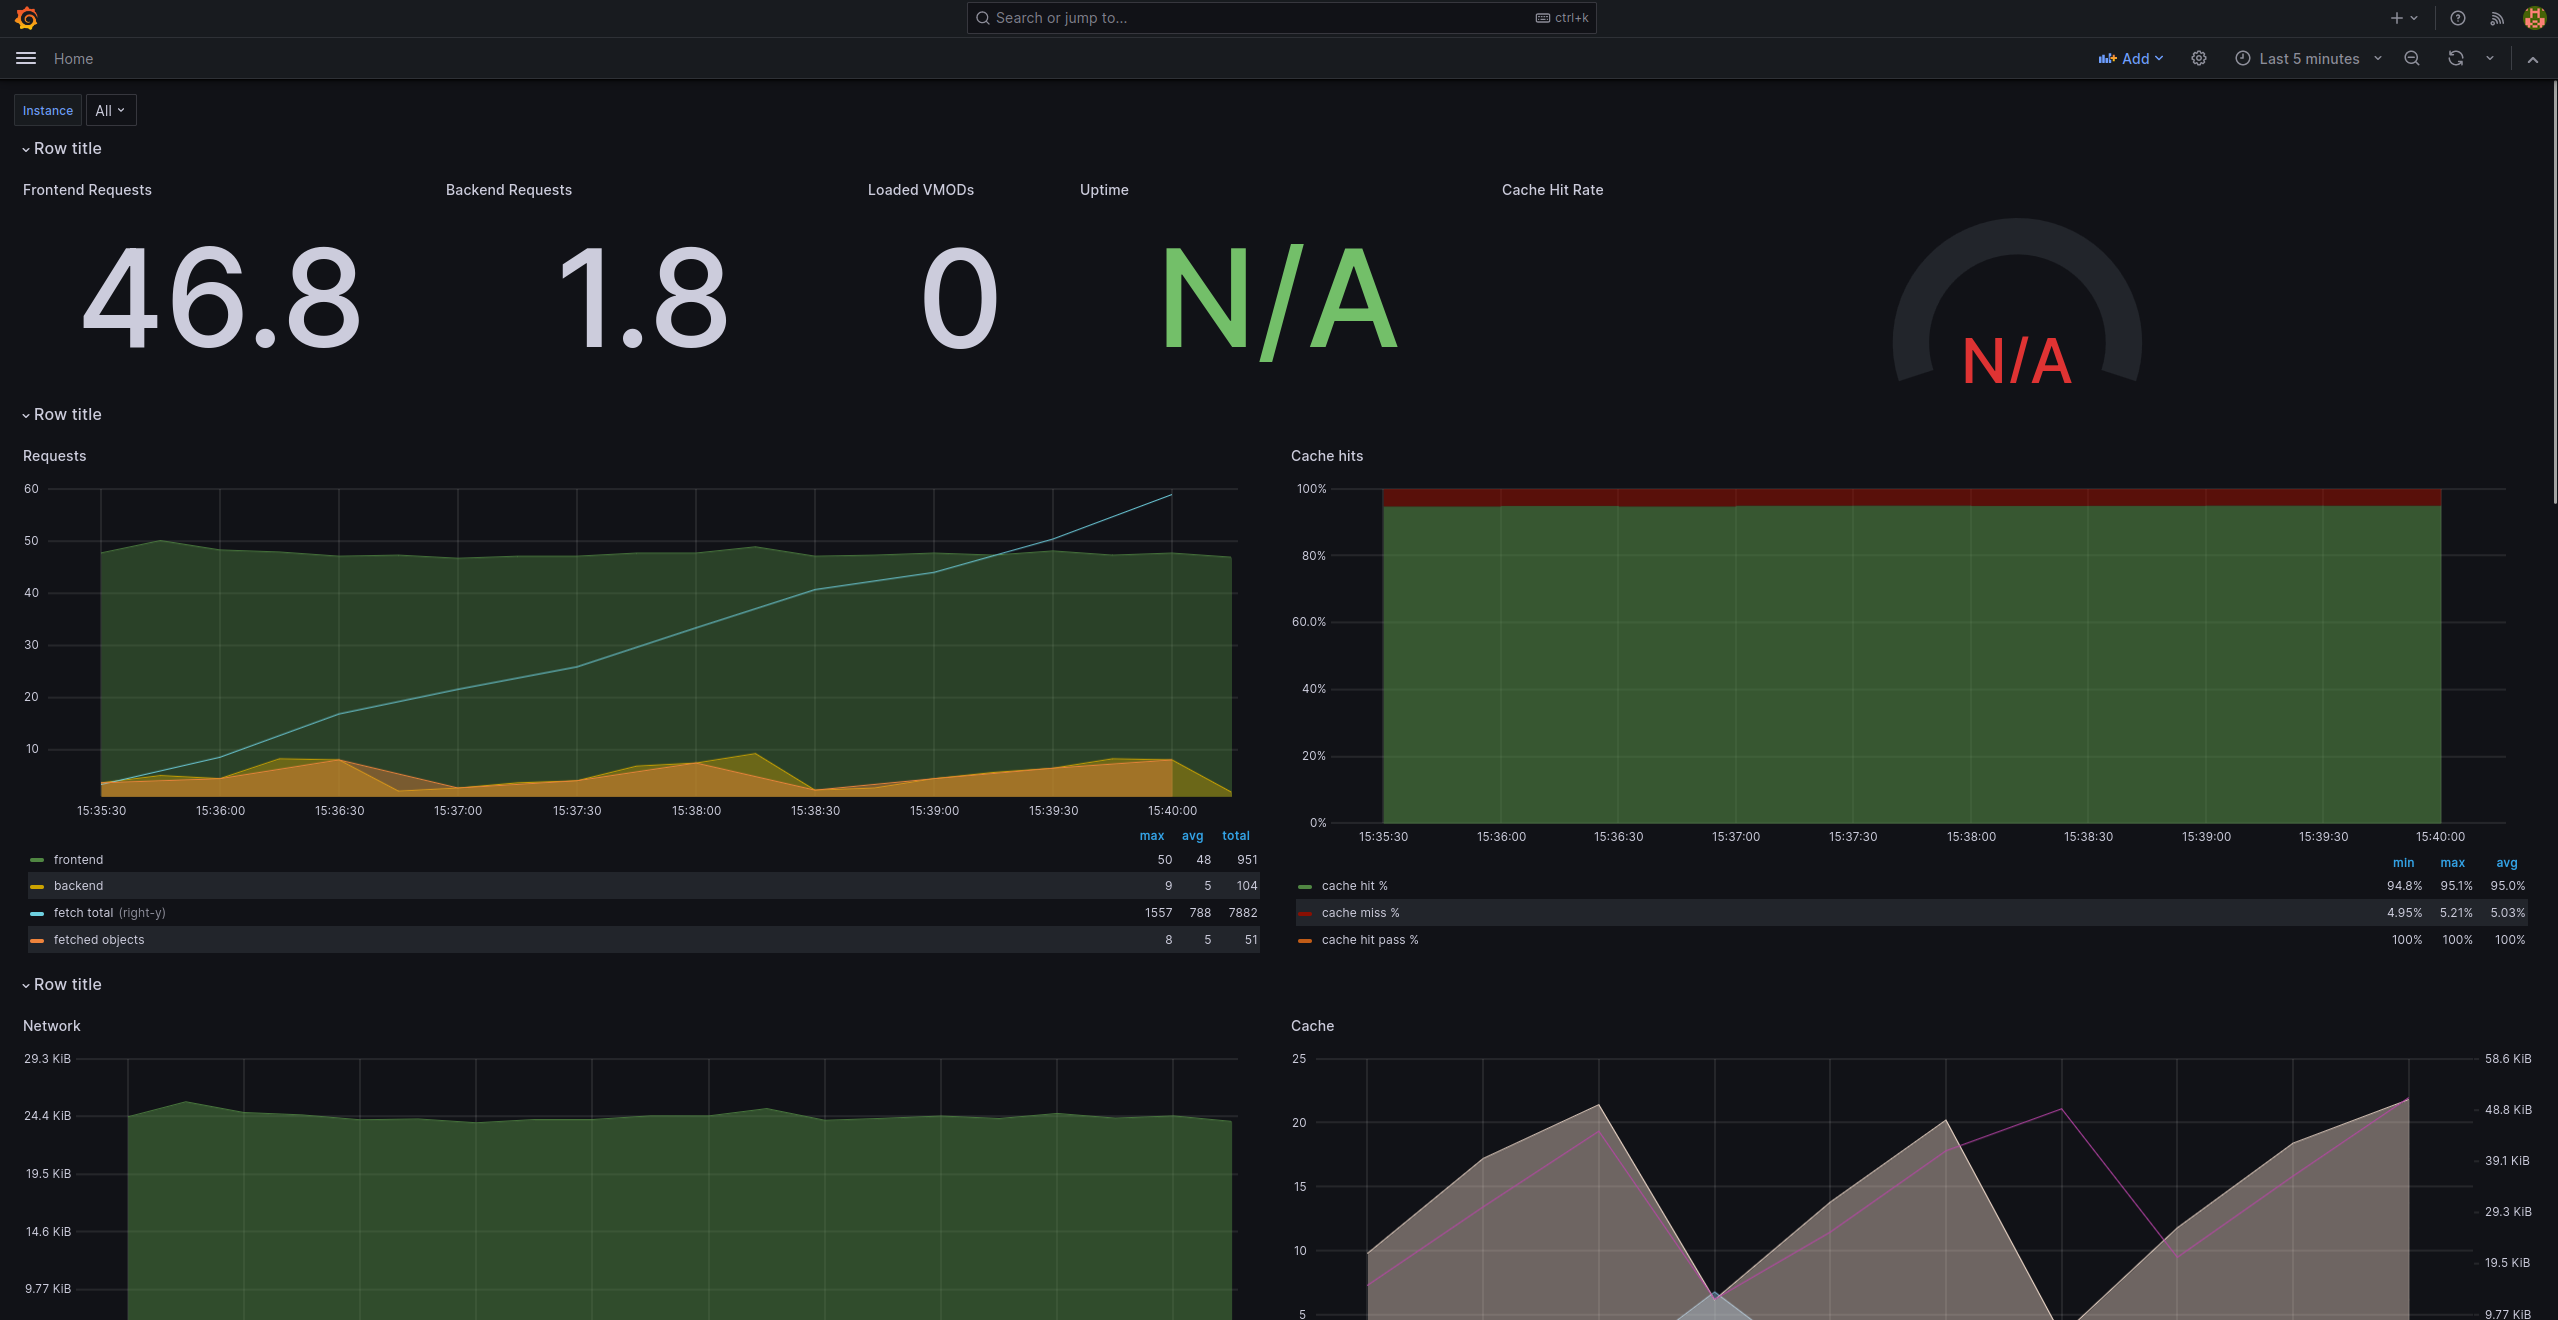
Let’s start poking around to see how all this works in the next sections.
Varnish, the origin and the client
Origin
We’re going to take it easy and start with the (very simple) origin. It’s almost entirely contained in this section of docker-compose.yaml:
  origin:
    image: python
    command: python -m http.server --directory /orig_data 80
    volumes:
      - ${ORIGIN_DATA}:/orig_data
This defines the origin service and tells docker compose use a python to start python -m http.server … which is a file server listening on port 80 and exposing the container’s /orig_data directory.
As we can see in the volumes section, /orig_data is actually mounted from the host, and to know which host directory is actually mounted, we need to look at the .env file which shows:
ORIGIN_DATA=./data
In other words: we mount our local data/ directory into the container and expose its content with a python server. Easy peasy.
Varnish
Now it gets fun! Fun, but not really complicated. Here are the important .env and docker-compose.yaml snippets:
# docker-compose.yaml
services:
  varnish:
    image: varnish
    command: -n varnish
    volumes:
      - workdir:/var/lib/varnish
      - ${VARNISH_VCL}:/etc/varnish/default.vcl
    ports:
      - "${HTTP_PORT}:80"
    depends_on:
      - origin
...
volumes:
  workdir:
    driver: local
    driver_opts:
      type: tmpfs
      device: tmpfs

# .env
HTTP_PORT=80
VARNISH_VCL=./conf/default.vcl
We define a varnish service, as expected, but we add a few bells and whistles.
Fixed work directory with -n varnish, it’ll get added to the container’s default command. Check the “Extra arguments” section on the official page. This make the directory predictable as it’s otherwise inferred from the machine host name, which will change for each container.
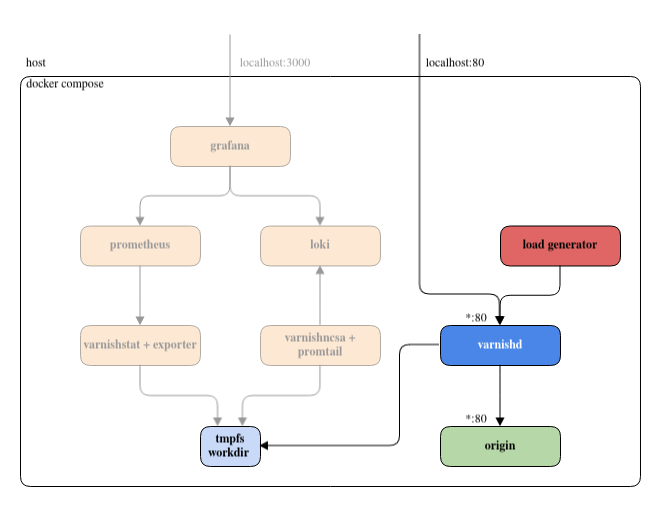
Shared work directory: we define a tmpfs volume called workdir, and we ask our container to mount it as /var/lib/varnish, so that any container mounting it can access the logs and metrics stored in it.
Startup order with depends_on. Varnish needs to wait for the origin service to be up first before starting. We’ll see why in the VCL explanation.
Mount the local configuration; our local ./conf/default.vcl is mounted as /etc/varnish/default.vcl, meaning that' what Varnish will run.
Port mapping: Varnish’s listening port will be exposed externally on port 80 on your machine, but you can change it by editing HTTP_PORT.
Testing
And we can check that varnish is indeed reachable and that the file server is indeed working with curl:
$ curl localhost:80 -I
HTTP/1.1 200 OK
Server: SimpleHTTP/0.6 Python/3.12.1              <----- the origin works!
Date: Thu, 18 Jan 2024 05:16:49 GMT
Content-type: text/html; charset=utf-8
Content-Length: 232
X-Varnish: 98506 33130                            <----- varnish too!
Age: 13
Via: 1.1 e072ed301501 (Varnish/7.4)
Accept-Ranges: bytes
Connection: keep-alive
VCL
Finally, we should really look at the vcl here, granted, it’s pretty dumb, but there’s a point to be made here:
vcl 4.1;

backend default { .host = "origin"; }

sub vcl_recv {
       # don't cache if the request path or querystring contains uncacheable
       if (req.url ~ "uncacheable") {
               return (pass);
       # create a synthetic response for heathcheck requests
       } else if (req.url == "/healthcheck") {
               return (synth(200));
       # otherwise, cache
       } else {
               return (hash);
       }
}

sub vcl_backend_response {
	set beresp.ttl = 10s;
}
However, please note the .host field of the backend: it’s origin. It matches the service of our origin, and docker compose will provide DNS resolution to the actual (somewhat random) IP address it created for the origin container.
And as you surely know, Varnish will resolve that host name when it’ll load the configuration, so we really, really need origin before Varnish so that the latter can DNS resolve the host of the former. That’s the whole reason for the depends_on field we saw above.
Load generator
This part is completely optional and really only exists so that we have some pretty graphs and logs already populated. You can find the complete code in load_generator.sh, which is run directly by a dedicated container:
services:
  load_generator:
    image: curlimages/curl
    volumes:
      - ./load_generator.sh:/usr/bin/load_generator
    command: /usr/bin/load_generator
    depends_on:
      - varnish
The code itself is just a few lines of shell script that will continuous create a bunch of requests tailored to our default.vcl shown above:
- Health checks to generate synthetic responses
- Some cacheable requests…
- And some uncacheable ones, less frequent
That’s it, we’ve cover the spine of the setup, giving both our varnish service a backend and some traffic, now it’s time to see how we can monitor it.
Prometheus, Loki and their exporters
We have looked at the core setup that serves content, now it’s time to explore the monitoring section of the project, in other words: how do we extract metadata for the system and how do we store it?
In our case, we are interested in two dimensions:
- Metrics: either counters (only go up) such as number of request served, or gauges (go up and down), for example the current space used in cache
- Logs: some text, formatted or not, describing an event
For both of these, we are going to have a store holding the data durably, and an exporter to extract data from varnish and push it to said store.
Metrics
Prometheus
Prometheus is an open-source system monitoring and alerting toolkit, that collects and stores its metrics as time-series data, i.e. metrics information is stored with the timestamp at which it was recorded, alongside optional key-value pairs called labels.
Within the docker-compose.yaml, we call Prometheus like this:
prometheus:
    image: prom/prometheus
    volumes:
      - ${PROMETHEUS_CONF}:/etc/prometheus/prometheus.yml
The PROM_CONF environment variable is within the hidden file .env and looks like this:
PROMETHEUS_CONF=./conf/prometheus.yml
In other words, we are just using the official Prometheus image, feeding it our custom prometheus.yml:
global:
scrape_interval: 15s # Set the scrape interval to every 15 seconds. Default is every 1 minute.
# define which exporters to scrape
scrape_configs:
- job_name: varnish
# 'exporter' is our exporter container in `docker-compose.yml`
# metrics_path defaults to '/metrics', scheme to 'http'
static_configs:
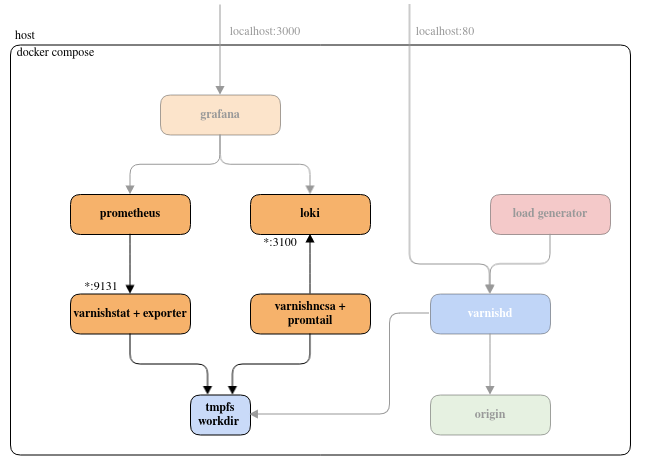
- targets: ["exporter:9131"]
We can see here that Prometheus is simply “scraping” the exporter for new data stats every 15 seconds, and we only have one target: the exporter container that we’re going to explain right away.
exporter
The exporter is a third-party open-source project that uses varnishstat internally (its jsonoutput, more precisely), thus we need to build a container that has both Varnish and the exporter installed. We are going to do this with a custom Dockerfile, except that here, the file is going to be inlined in docker-compose.yaml, under the cleverly named dockerfile_inline field. If Docker sees that the container doesn’t exist, it will build if using those instructions.
exporter:
    image: stat-exporter
    command: /tmp/prometheus_varnish_exporter -n varnish -verbose
    volumes:
      - workdir:/var/lib/varnish
    depends_on:
      - varnish
    build:
      dockerfile_inline: |
        FROM curlimages/curl
        RUN set -ex; \
            cd /tmp/; \
            curl -L https://github.com/jonnenauha/prometheus_varnish_exporter/releases/download/1.6.1/prometheus_varnish_exporter-1.6.1.linux-amd64.tar.gz | tar xvzf - --strip 1
        FROM varnish
        COPY --from=0 /tmp/prometheus_varnish_exporter /tmp/prometheus_varnish_exporter

volumes:
  workdir:
    driver: local
    driver_opts:
      type: tmpfs
      device: tmpfs
An important note is the workdir volume that is defined at the root level as tmpfs and mounted as /var/lib/varnish in the container, which we also do in the Varnish container, remember?.
We do this because internally the exporter uses varnishstat which needs access to varnishd’s work directory. The problem is that this directory is in the varnish! So we build the workdir globally, and we ask every container that needs read or write access to it to simply mount it. You are also going to see this pattern for the promtail container, which is logical, since it uses varnishlog to extract logs.
amd64 chips, if you have a Mac or arm64 chip, this will not work locally, you should use a Vanir box instead. The smallest box does not have enough memory for the container to start up though, I used a Standard 2Vcpu 4Gb box.Logs
Loki
Loki describes itself as “like Prometheus, but for logs” on GitHub, but differs by focusing on logs instead of metrics, and delivering logs via push, instead of pull, and uses a label based approach for indexing.
A Loki-based logging stack consists of 3 components:
- Promtail is the agent, responsible for gathering logs and sending them to Loki.
- Loki is the main server, responsible for storing logs and processing queries.
- Grafana for querying and displaying the logs.
The container definition is our shortest yet:
loki:
    image: grafana/loki:2.9.0
    command: -config.file=/etc/loki/local-config.yaml
It’s the default image, running the default configuration, we don’t mount or redefine anything, meaning we can expect Loki to run on its default 3100 port.
Promtail
Promtail is an agent that ships the contents of local logs to a private Grafana Loki instance or Grafana Cloud. It is usually deployed to every machine that has applications needing monitoring. It is also supported by Grafana and generic for different log inputs by reading stdin, meaning we can just pipe the varnishncsa output to it and everything will work.
Promtail primarily:
- Discovers targets.
- Attaches labels to log streams.
- Pushes them to the Loki instance.
We can see the code for Loki and Promtail in this snippet from the docker-compose.yaml below:
  promtail:
    image: ncsa-promtail
    entrypoint: ""
    command: bash -c "varnishncsa -n varnish | promtail -config.file=/etc/promtail/config.yml --stdin"
    volumes:
      - ./conf/promtail-config.yaml:/etc/promtail/config.yml
      - workdir:/var/lib/varnish
    build:
      dockerfile_inline: |
        FROM curlimages/curl
        RUN set -ex; \
            curl -sLo https://github.com/grafana/loki/releases/download/v2.8.7/promtail-linux-amd64.zip | unzip -d /tmp -; \

        FROM varnish
        COPY --from=0 --chmod=555 /tmp/promtail-linux-amd64 /tmp/promtail
We recognize the usual logic of mounting the configuration file, but also the workdir volume, and the now familiar dockerfile_inline downloads a zip file rather that a deb, but it’s all very straightforward.
The promtail-config.yaml looks like this:
clients:
  - url: http://loki:3100/loki/api/v1/push
Simply put, we are just indicating where the Loki instance is so that promtail can push to it. Notice how in the previous case Prometheus was the storage was pulling data from the exporter, but in the log case, the exporter is pushing to the storage.
Grafana
It’s now time to study the star of the show. With all the foundations dealt with, we can finally put or log and metrics visualizer on top of the stack.
Main configuration
Thanks to the previous work done to set up Prometheus and Loki, we can integrate Grafana with just a handful of yaml and json files. Here’s the entirety of the grafana configuration:
conf/grafana/
├── grafana.ini
└── provisioning
    ├── dashboards
    │   ├── default.yaml
    │   ├── varnish_logs.json
    │   └── varnish_metrics.json
    └── datasources
        ├── loki.yaml
        └── prometheus.yaml
First, let’s look at how we start grafana by looking at the relevant bits from docker-compose.yaml and .env:
# docker-compose.yaml:
  grafana:
    image: grafana/grafana-enterprise
    ports:
      - 3000:3000
    volumes:
      - ${GRAFANA_CONF}:/etc/grafana/grafana.ini
      - ${GRAFANA_PROVISIONING}:/etc/grafana/provisioning/

# .env
GRAFANA_CONF=./conf/grafana/grafana.ini
GRAFANA_PROVISIONING=./conf/grafana/provisioning
By now, this should look fairly standard: we expose the 3000 to the host, which we used to log in. And we mount grafana.ini and the provisioning/ into the container, at their default locations, where grafana expects them, and that’s it.
It turns out we don’t need to configure much either, at least in grafana.ini, here is its full content:
[auth]
disable_login_form = true

[auth.anonymous]
enabled = true
org_role = Admin

[dashboards]
default_home_dashboard_path = /etc/grafana/provisioning/dashboards/varnish_metrics.json
This file does two things: enable anonymous access with admin role (do NOT use this in production), and select a default dashboard as a landing page (the one that’s screenshot in the previous section). And to be honest, we could have provided an empty file as grafana has default values for every option.
Dashboards
Metrics
Let’s have a look at the file pointed at by default_home_dashboard_path, like the other files, we can find it in the conf/ directory:
# cat conf/grafana/provisioning/dashboards/varnish_metrics.json
{
  "annotations": {
    "list": [
      {
        "builtIn": 1,
        "datasource": {
          "type": "grafana",
<and it goes on for about 2000 lines>
That is just one big JSON file describing everything you can see on the landing screen we talked about, each graph, tooltip, and formulas needed by grafana to present the page is encoded here.
This specific dashboard is really just an import of a popular Varnish dashboard on the grafana registry. If the file looks complex, do not worry, you’ll probably never update it manually. Rather, you’ll use the grafana interface to visually edit it, then you’ll export it as JSON. Much simpler!
However, there’s one part that is import in that file, or rather, many important parts, and they all look like this:
…
        {
          "datasource": {
            "type": "prometheus",
            "uid": "prometheusUID"
          },
…
They tell grafana which data source to use for each graph, and they are using uid to identify it, in this case, it’s prometheusUID, remember it, it’ll come up again soon (you can also jump to the “Data sources” section a bit below)!
Logs
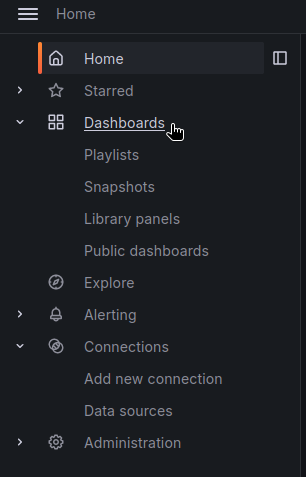
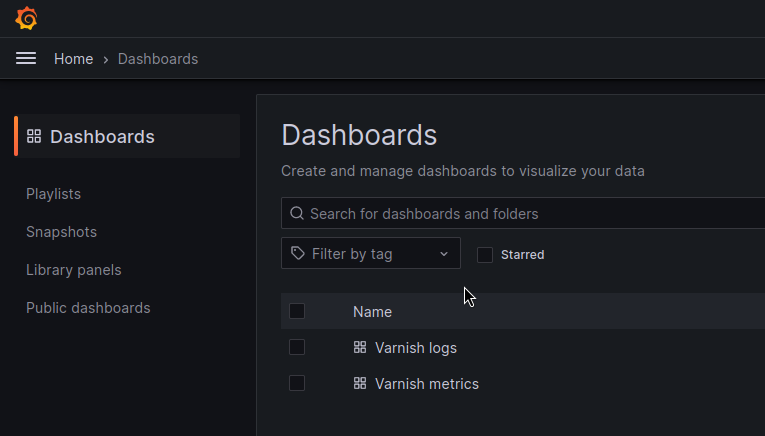
We’ve covered statistics, now it’s time to tackle logs! On the upper left corner, open the home menu, and click on “Dashboards”
This takes us to the Dashboard page (duh!), where we can see a list with our metrics dashboard, but also something listed as “Varnish logs”, let’s click on that:
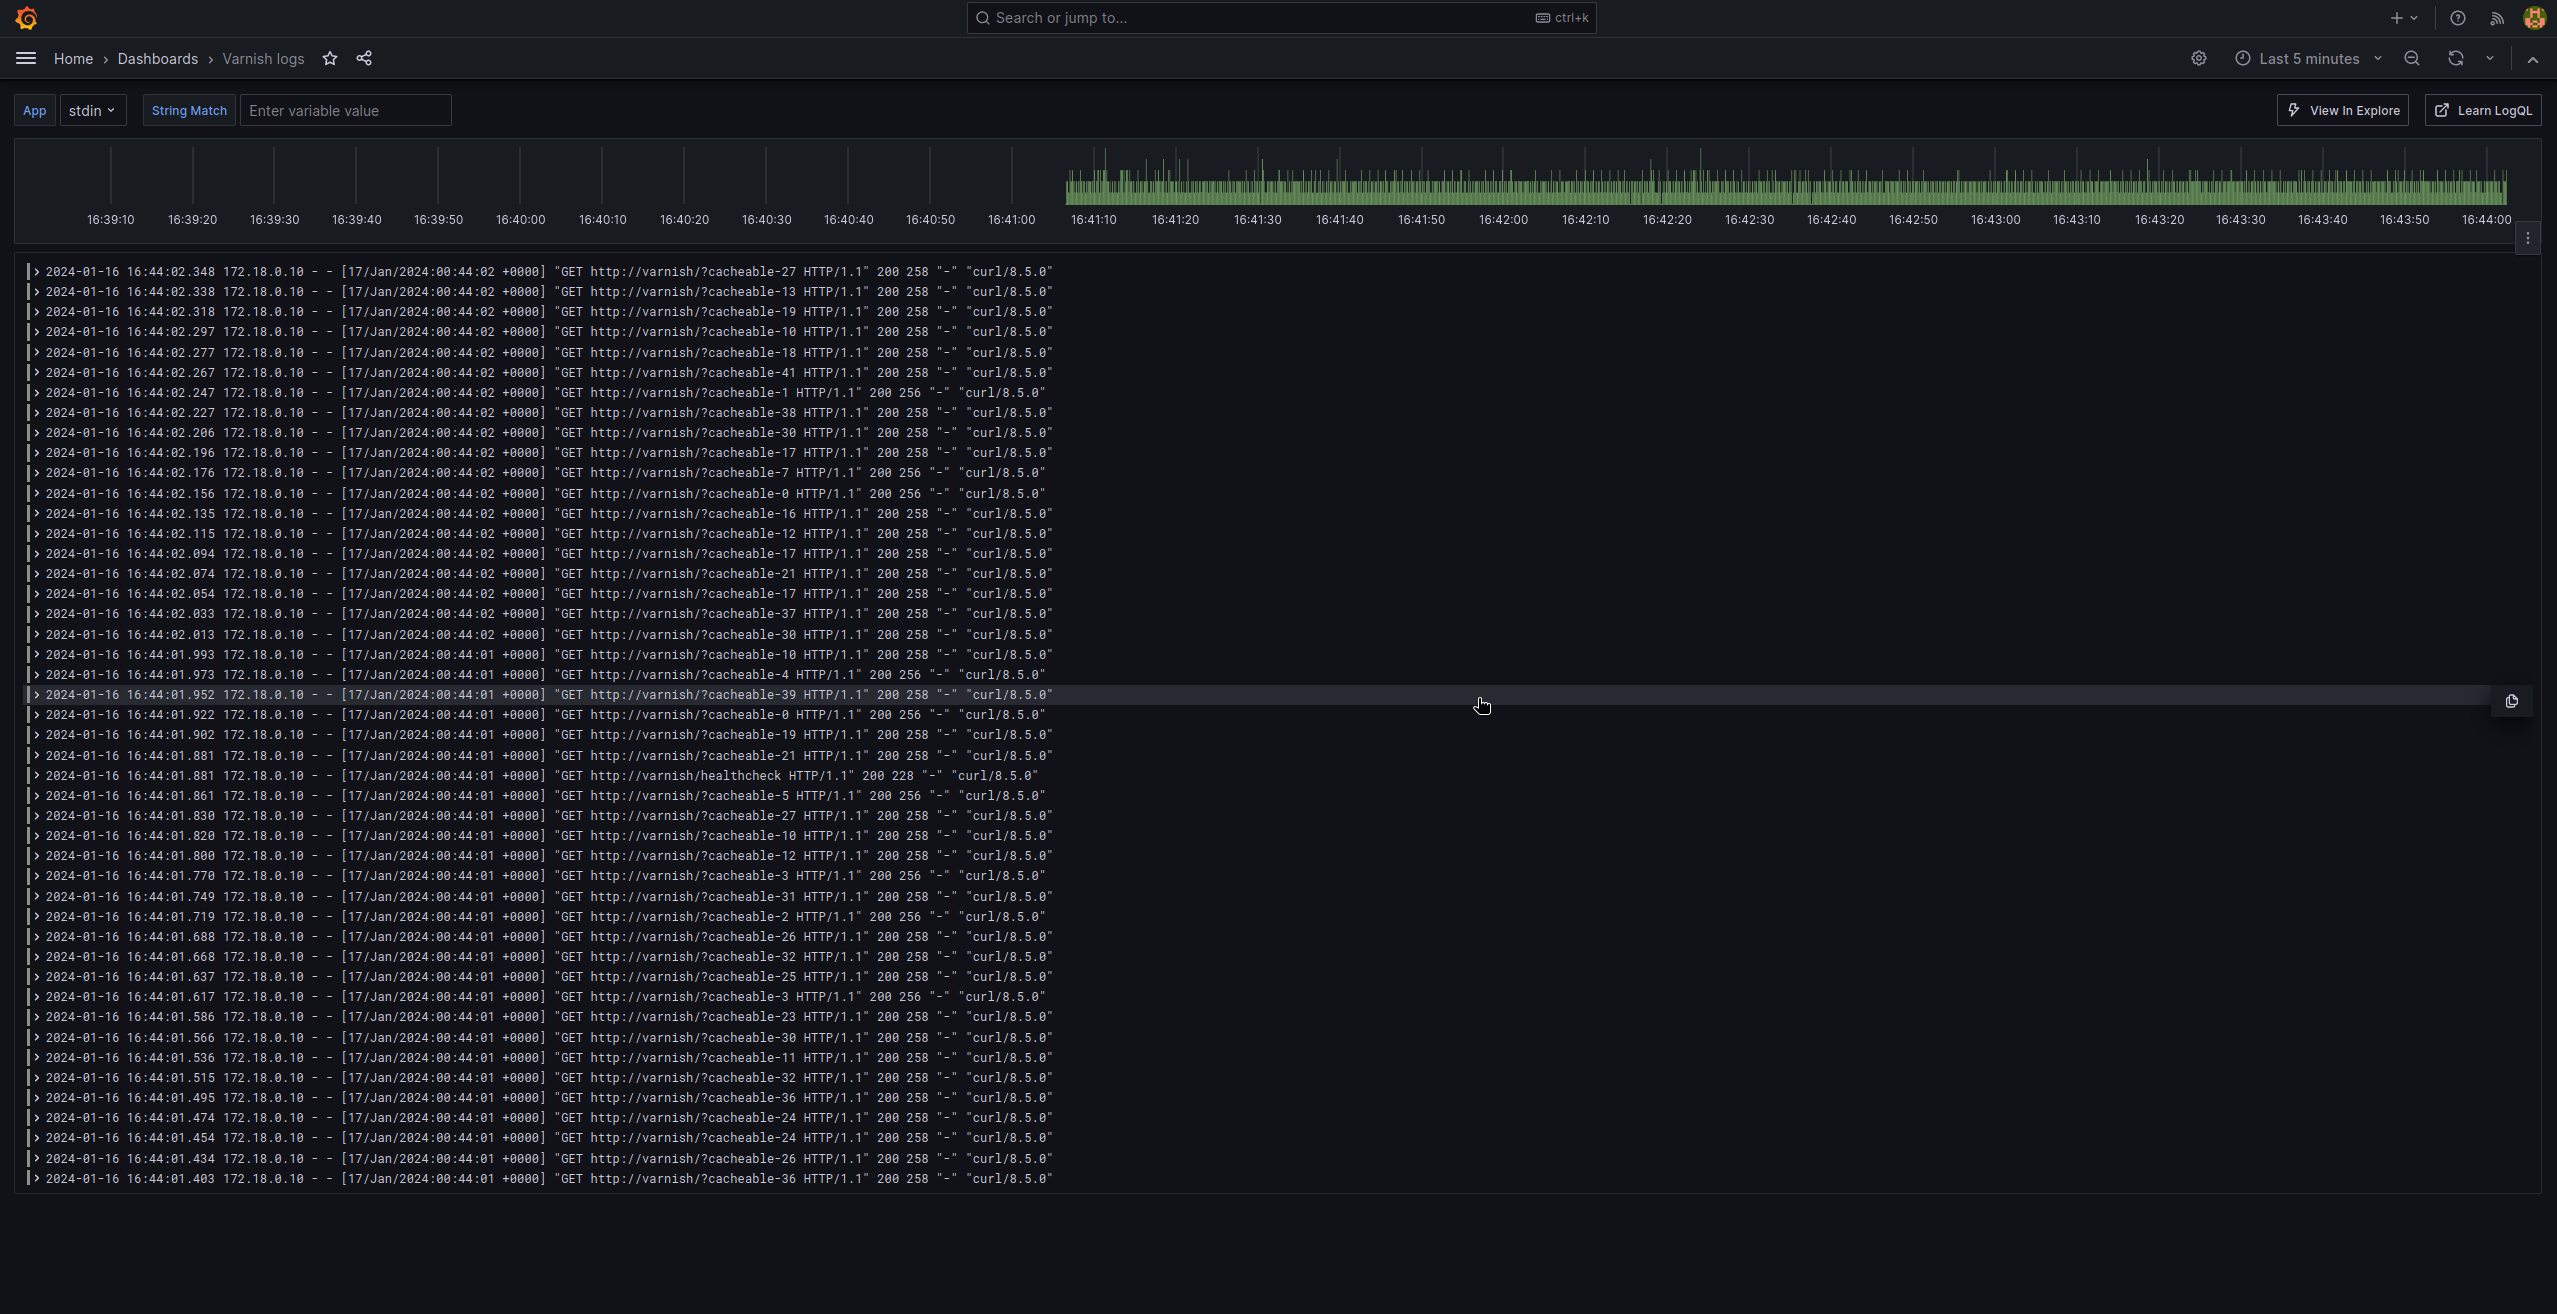
The dashboard is much simpler that the metrics one, but it follows the same logic: we “just” have a big JSON file (varnish_logs.json) using the loki database we set up earlier. And this time, the JSON contains
      "datasource": {
        "type": "loki",
        "uid": "lokiUID"
      },
The provider concept
By now, you might be wondering: “ok, grafana.ini was a fairly standard file with a default path, no wonder grafana found it, but how did it know about varnish_logs.json and varnish_metrics.json? There’s no way it would expect those!?!”
And that’s a very good question! It turns out that grafana looks for yaml files in /etc/grafana/provisioning/dashboards/, and we mount this file there:
# cat conf/grafana/provisioning/dashboards/default.yaml
apiVersion: 1

providers:
  - name: Default # A uniquely identifiable name for the provider
    type: file
    options:
      path: /etc/grafana/provisioning/dashboards/
What we are saying here it “check for dashboard files in /etc/grafana/provisioning/dashboards/ and load them up”, and grafana will happily oblige. The interesting thing is that this “provider” is able to reload files as they get update, among other things. We are not using that feature here for the sake of simplicity, but be aware it’s one of its features.
Data sources
And we are almost done tying things together, we just need to look at data sources, and they will clarify how our JSON dashboards are able to find our Prometheus and Loki servers.
Same as for /etc/grafana/provisioning/dashboards/, grafana will check /etc/grafana/provisioning/datasources/ for data sources description. Let pause a moment to marvel at the consistency of the naming, for once in the IT world, it makes immediate sense!
Anyway, here’s the content of our two files in that directory:
# cat conf/grafana/provisioning/datasources/prometheus.yaml
apiVersion: 1

datasources:
  - name: Prometheus
    type: prometheus
    access: proxy
    uid: prometheusUID
    url: http://prometheus:9090

# cat conf/grafana/provisioning/datasources/loki.yaml
apiVersion: 1

datasources:
  - name: loki
    type: loki
    uid: lokiUID
    access: proxy
    url: http://loki:3100
Very short, and very sweet, each file describes a data source, gives it a uid and explain which url to use to contact it. That was how we go from the JSON dashboard listing only the uid to the actual server we spun up using docker compose.