Monitoring Varnish with New Relic
To follow along, you will need at least one server, with root access, and Varnish 6.0+ installed on it.
If you don’t already have a New Relic account, you can sign up for a free account.
Getting started
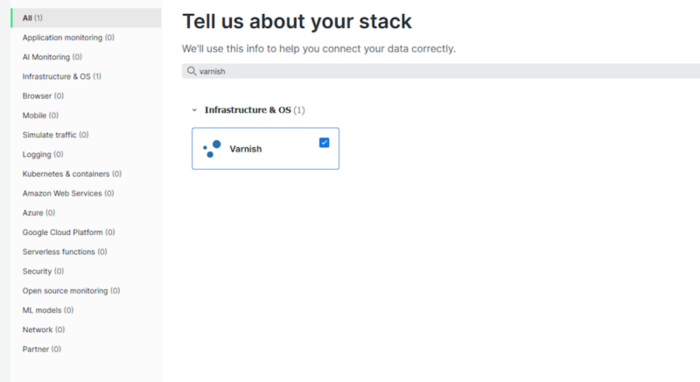
Once you’ve signed up for your New Relic account, it should take ask you about your stack, make sure you select at least “Varnish” from the list.
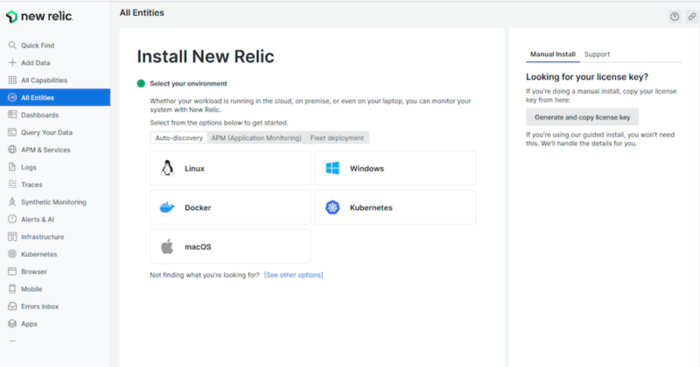
Operating system selection
Click next then select you OS, which will most likely be Linux.
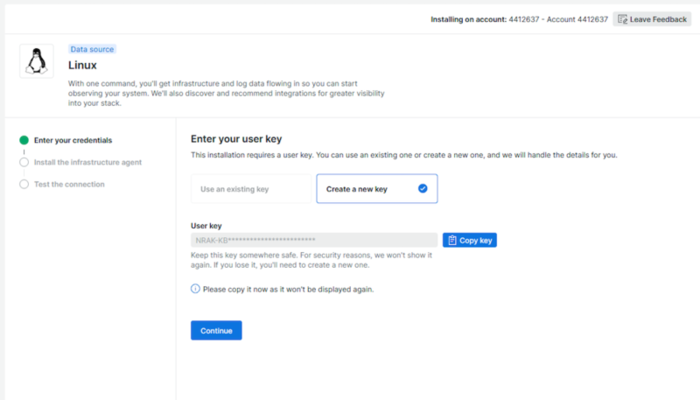
API key creation
Then, we need a corresponding API key to assign to the New Relic agent we will install in a later step. Create a new one, and remember to copy it somewhere safe, although you don’t technically need it for the rest of the process.
Agent installation
They provide a curl script to copy to your command line that includes running the installation script. If you prefer to see and perform each individual step yourself, you can use the documentation for manual installation.
Automatically answer "yes" button before copying the command for an unattended installation.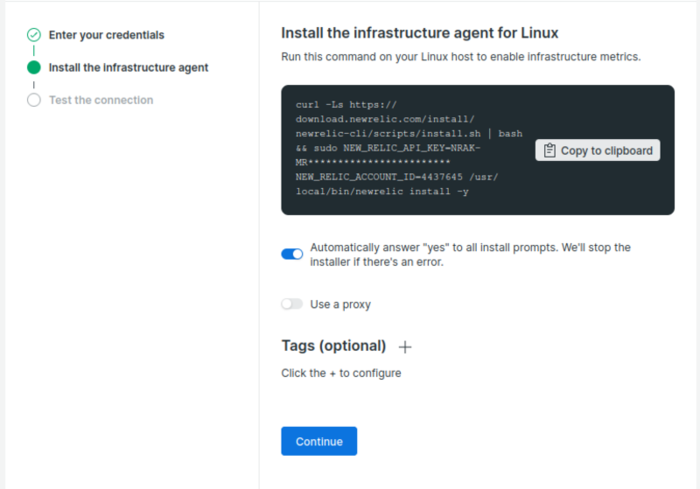
So either use the curl command to automatically install the agent, or do it manually using the documentation mentioned earlier.
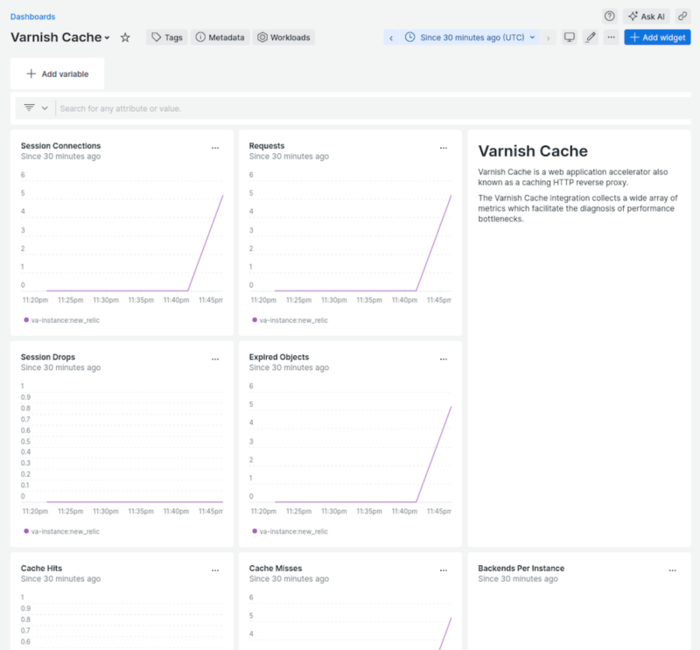
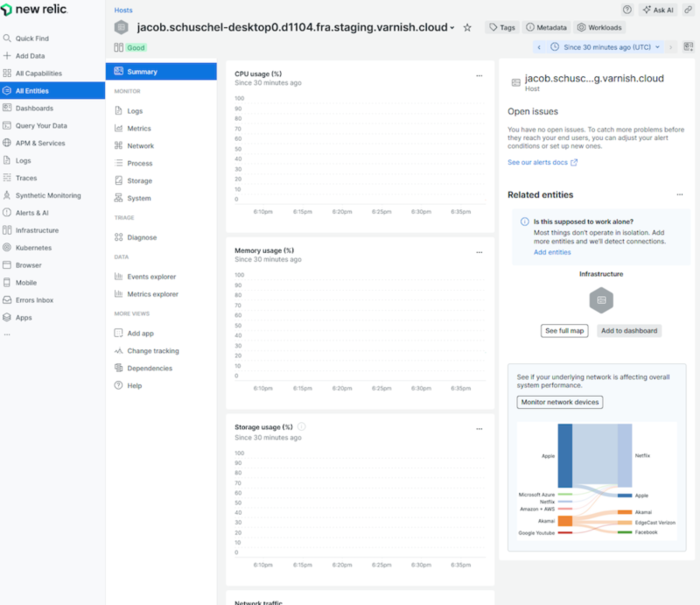
The initial graphs
Once installed you can test your connection and get initial graphs:
Using Varnish as a data source
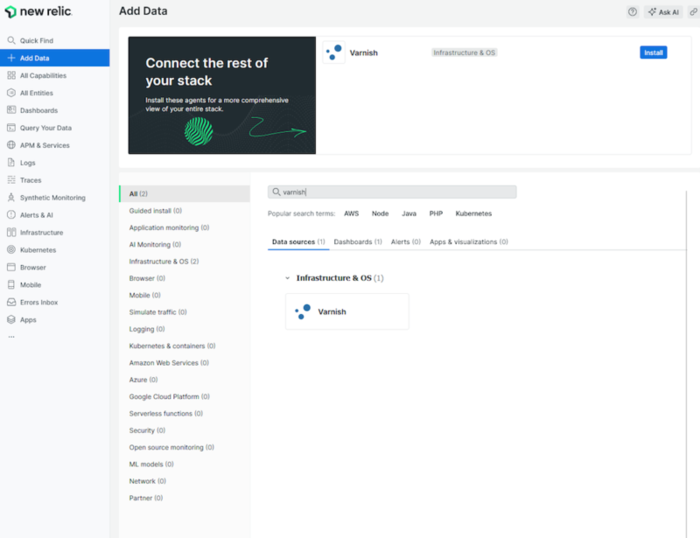
Once the agent is installed, we need to connect the agent to Varnish so it can be used as a data source. In order to do this, we will install another connector New Relic has put out specifically to work with Varnish. To begin, look at the left side menu.
At the top of the left side menu there is an “+ add data” button. Using that we can find Varnish:
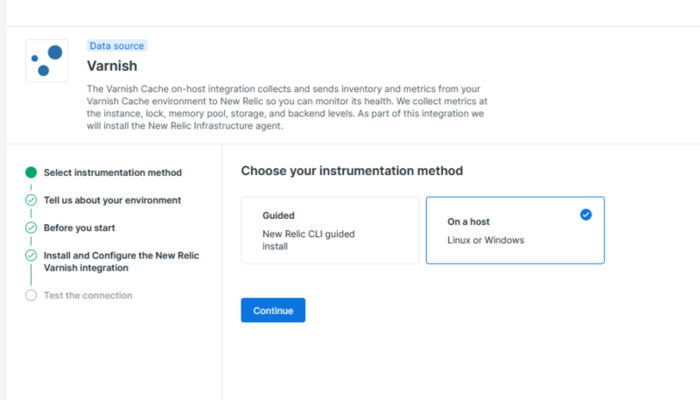
Instrumentation method and environment details
There is a guided tour that will use a key and provide you with a bash command to curl and run the install script. This will install well for Varnish Open Source, however the Enterprise version is not automated.
Since we assumed at the beginning that Varnish would already be installed, instead of the guided CLI install, select the “On a host” option:
Install and configure New Relic Varnish integration
Answer the questions until you get to the 4th . step, “Install and Configure the New Relic Varnish integration”. The page you want to stop on should look like the following:
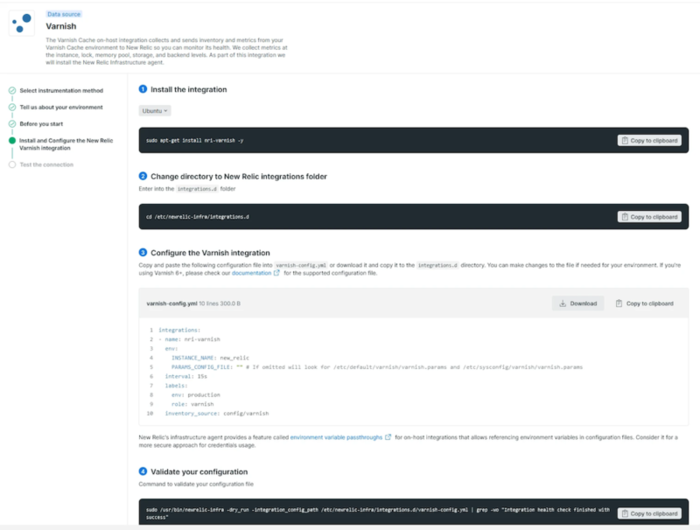
Step 1. is the most important as it installs the Varnish integration, but step 2. and 3. lack a few items, so here’s the full setup:
# all the commands are meant to be run as root

# enable the metrics integration
cat << EOF > /etc/newrelic-infra/integrations.d/varnish-config.yml
integrations:
- name: nri-varnish
  env:
    INSTANCE_NAME: new_relic
    PARAMS_CONFIG_FILE: "" # If omitted will look for /etc/default/varnish/varnish.params and /etc/sysconfig/varnish/varnish.params
  interval: 15s
  labels:
    env: production
    role: varnish
  inventory_source: config/varnish

# enable the logging integration
cat << EOF > /etc/newrelic-infra/logging.d/varnish-config.yml
logs:
  # Basic tailing of a single file
  - name: varnish
    file: /var/log/varnish/varnishncsa.log
    application: varnish

# activate varnishlogging
systemctl start varnishncsa
You can then proceed with step 4. to test your configuration.
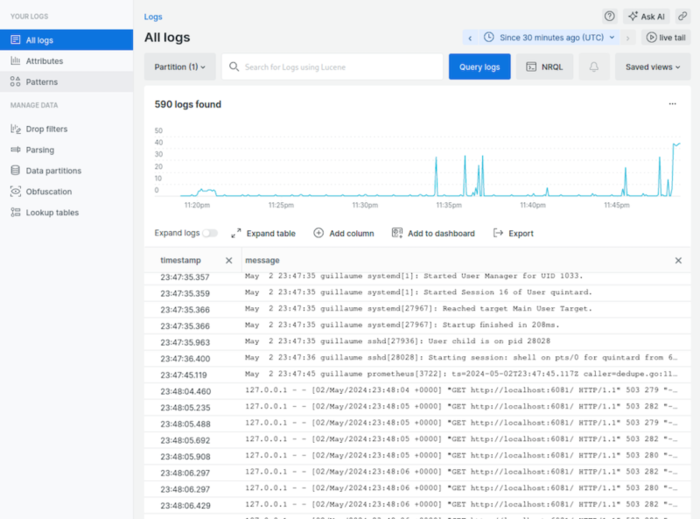
Logs and statistics
Send some request to Varnish and you’ll be able to see new data popping up in both the Varnish dashboard and in the log section.