Monitoring Varnish with Dynatrace
To follow along, you will need at least one server, with root access, and Varnish 6.0+ installed on it.
If you don’t already have a Dynatrace account, you can sign up for a 14-day trial account.
The process is straightforward and you should soon receive an email offering you to access your environment, with its domain name looking something like xxxxxxxx.apps.dynatrace.com.
The search function will allow you to explore most features but also look for documentation.
OneAgent
Metrics and logs are collected using a daemon, OneAgent, running on each monitored machine. Interestingly, most of the time, you don’t need to configure it locally, and you’ll instead do it globally from the web environment.
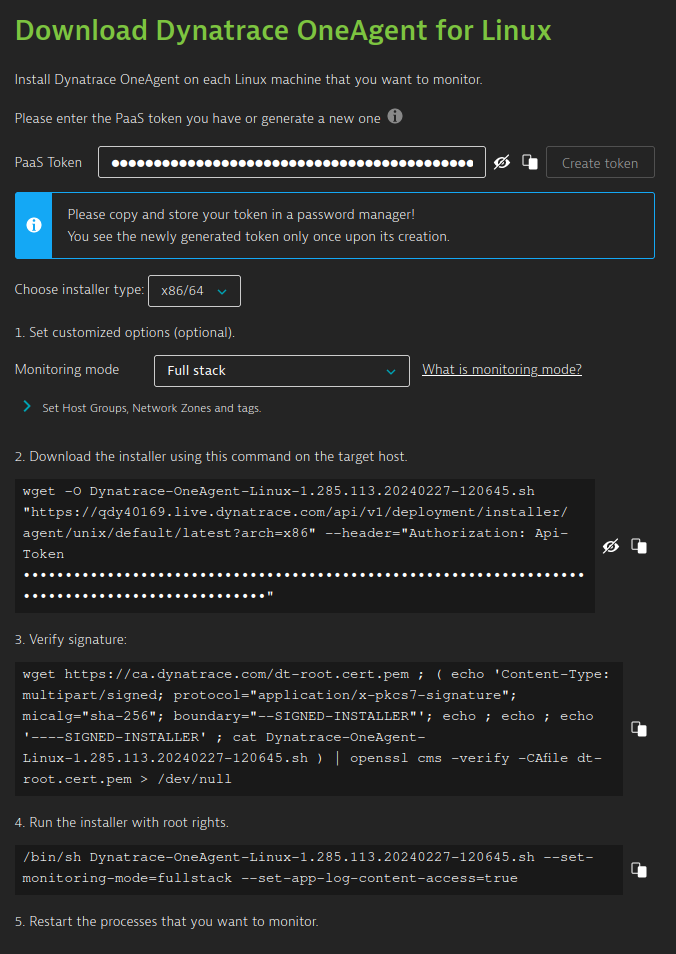
You can find details to install the agent in at least two ways:
- go to https://xxxxxxxx.apps.dynatrace.com/ui/apps/dynatrace.classic.deploy.oneagent/#install/agentlinux (change the domain to your particular domain)
- in your environment, search for “oneagent” and select “Deploy OneAgent“
Then, follow the instructions on the screen to install a pre-configured agent on one or many servers.
Configuration
Logs
Getting logs is easy, first you’ll want to start the varnishncsa service, as illustrated below:
systemctl enable --now varnishncsa
This service will start writing logs to /var/log/varnish/varnishncsa.log (and logrotate them if needed), so we just need to let Dynatrace know about it.
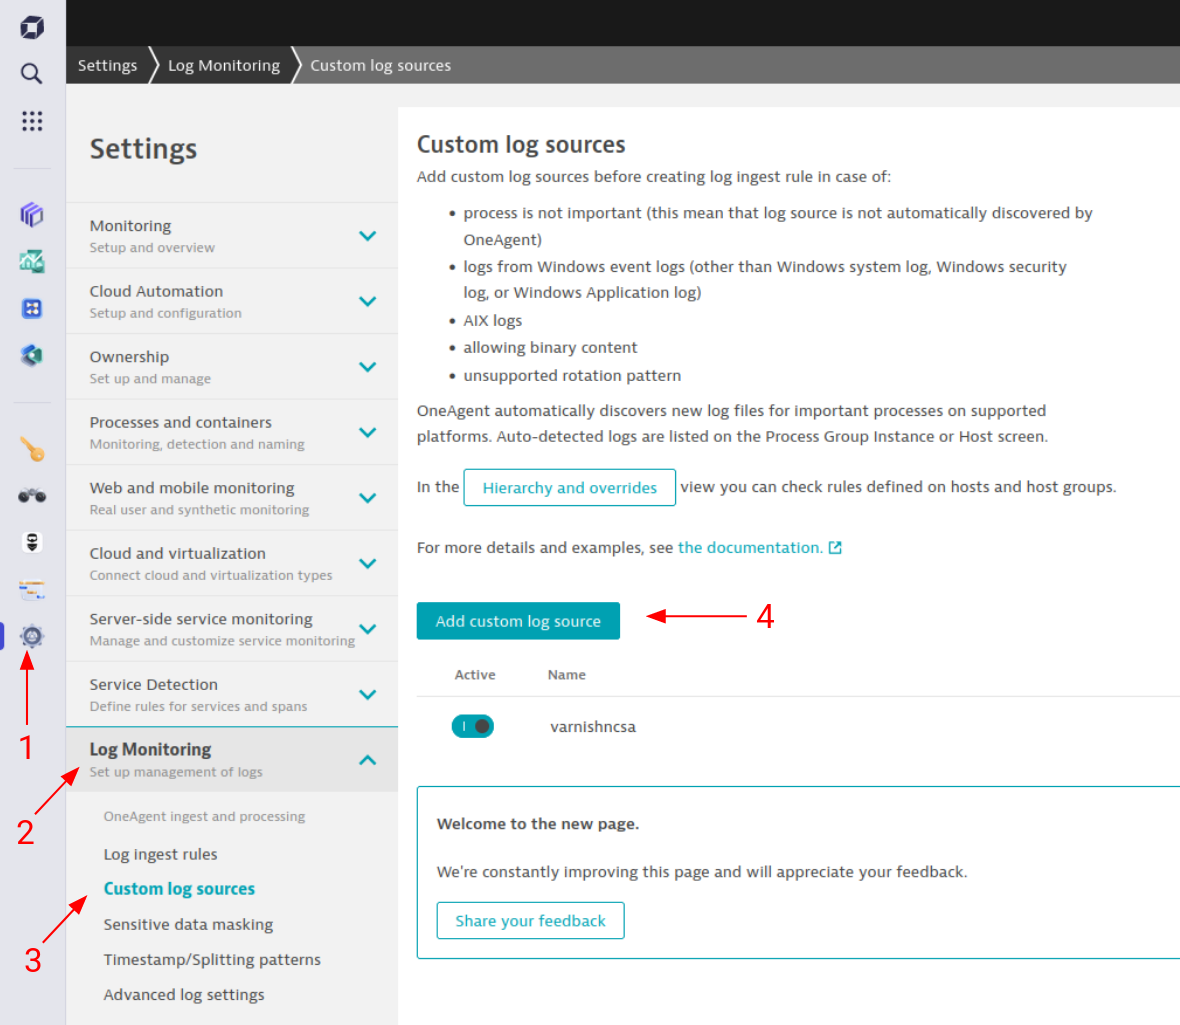
Head over to you web environment and go to Settings > OS Services Monitoring > Log Monitoring > Custom Log Sources > Add custom log source:
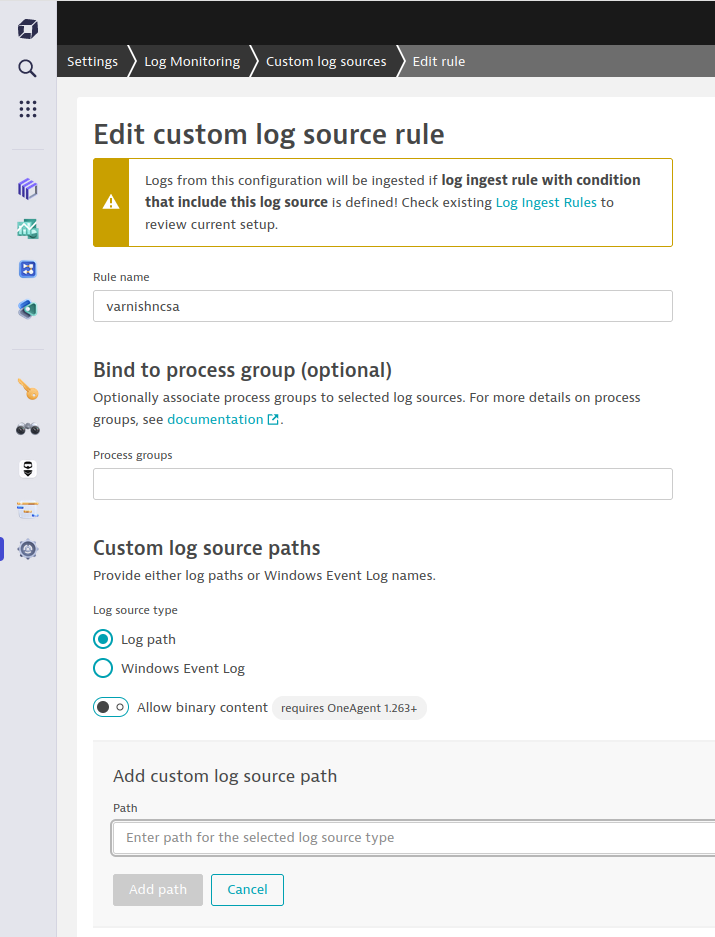
Add our file:
- Rule name: “varnishncsa”
- Log source type: “Log path”
- Add custom log source path:
/var/log/varnish/varnishncsa.logthen click on “Add path” - Click on “Save changes”
To see the logs:
- Go to “Dashboards”
- Add a dashboard with the “+ Dashboard”
- Click the purple “+” sign in the top right, then select “Logs”
- Add a filtering rule:
- Click on the purple “+” sign on the right, next to the “Limit” field, then “log.source”
- Type “varnish” in the “filter value“ field
- Click “Run“
Your Varnish logs, if any exists, should appear in the preview window.
You might notice that the format is a bit redundant though, since both varnishncsa and Dynatrace log the time, so you may want to tweak the log format a bit. For more information, check the output of systemctl cat varnishncsa.service.
Metrics
Dynatrace proposes a Python script to push metrics using HTTP. However, we can do something a tiny bit simpler: OneAgent comes with a tool called dynatrace_ingest that we can use in a simple bash script. For the sake of convenience, we’ll wrap it into a systemd service.
Create our reporting shell script:
cat << 'EOF' > /usr/bin/varnish-dynatrace
#! /usr/bin/bash
{
  while true; do
    sleep 10
    varnishstat -1 -t off |awk '{ s=gensub(/VBE\.([^.]*).(.*)/, "VBE.\\2,vcl=\\1", "g", $1); printf("varnish.%s %d\n", s, $2)}'
  done
} | /opt/dynatrace/oneagent/agent/tools/dynatrace_ingest
EOF
chmod +x /usr/bin/varnish-dynatrace
Create a unit file:
cat << 'EOF' > /etc/systemd/system/varnish-dynatrace.service
[Unit]
Description=Push Varnish metrics to Dynatrace
After=network-online.target nss-lookup.target

[Service]
Type=simple
ExecStart=/usr/bin/varnish-dynatrace

[Install]
WantedBy=multi-user.target
EOF
Enable the unit:
systemctl enable --now varnish-dynatrace
To see the metrics:
- Go to Dashboards
- Add a dashboard with the “+ Dashboard”
- Click the purple “+” sign in the top right, then select “Metrics”
- Click on “Select metric” and type “varnish.MAIN.client_req”
- Click “Run“
All metrics will be reported every 10 seconds as they appear in varnishstat -1, apart from VBE.*counters from which the backend name is extracted and added as a dimension.