Monitoring Varnish with Datadog
To follow along, you will need at least one server, with root access, and Varnish 6.0+ installed on it.
If you don’t already have a Datadog account, you can sign up for a 14-day trial account.
Agent
Installation
Once your account has been created and verified, the website will ask a few questions, including what software you want to monitor. Make sure to pick at least Varnish from the list.

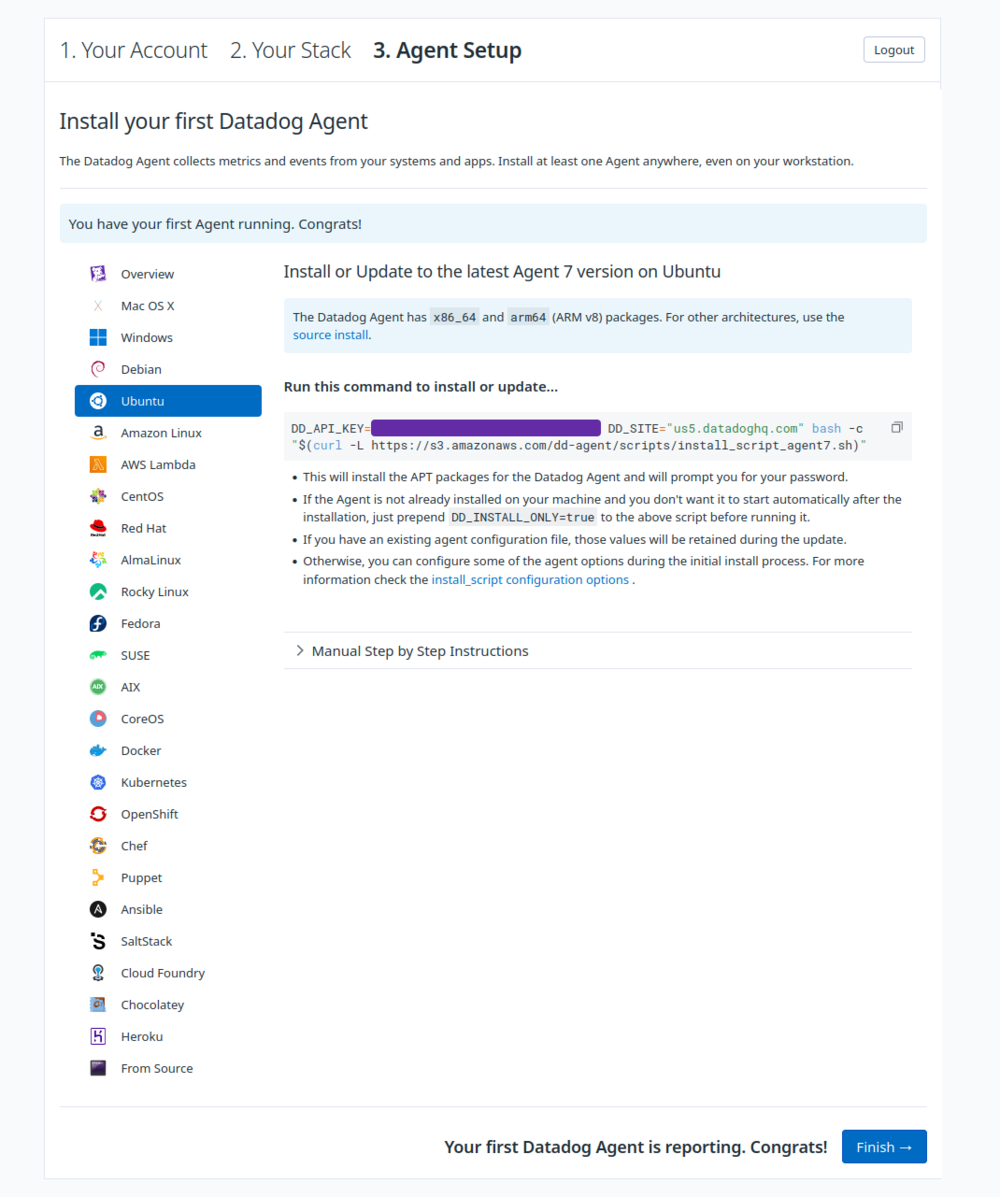
On the next page, the setup will offer a list of operating systems, each with instructions on how to install the Datadog agent. Pick the right OS and install the agent; on linux it should amount to copy-pasting a single command into your server’s terminal.
Once the new agent s installed and has reported back to Datadog, the configuration page will update with confirmation that your agent is running and will prompt you to finish the setup, just click the ‘Finish’ button.
Enabling the Varnish integration
After the initial configuration is completed, you’ll be brought to your Datadog account page where you can create dashboards, add integrations, etc. You should see “Varnish Cache” as one of the integrations ready to add.
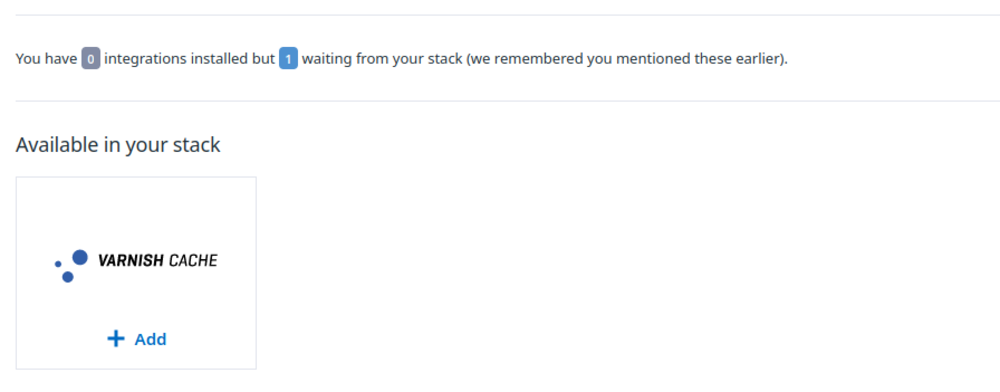
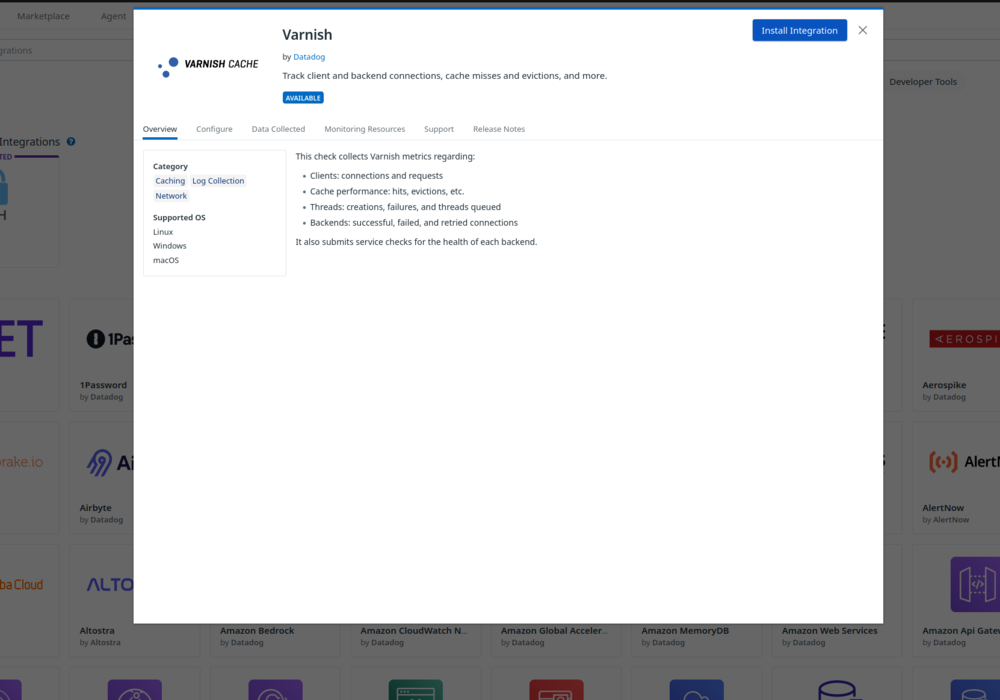
Clicking ‘+ Add’ will take you to the Varnish integration installation window. Install the integration, which should be automatic and take only a few seconds. Once it’s donce, we can leave the website and configure the server itself.
On the server
While the agent is actively reporting and the Varnish integration is enabled, we still need to configure a few things.
Permissions
First, we need to make sure that the agent can access the varnish tools:
# varnishstat access for metrics
usermod -G varnish -a dd-agent
# secret to retrieve backend health
chown :varnish /etc/varnish/secret
# right to run varnishadm
echo 'dd-agent ALL=(ALL) NOPASSWD:/usr/bin/varnishadm' | sudo EDITOR='tee -a' visudo
Agent configuration
Now, let’s give give ourselves a base configuration:
cat << EOF > /etc/datadog-agent/conf.d/varnish.d/conf.yaml
instances:
  - varnishstat: /usr/bin/varnishstat
    varnishadm: /usr/bin/varnishadm
logs:
  - type: file
    path: /var/log/varnish/varnishncsa.log
    source: varnish
EOF
We also need to enable logging. In /etc/datadog-agent/datadog.yaml, set logs_enabled to true:
logs_enabled: true
You can now restart the agent:
systemctl restart datadog-agent
You can check the status of the Datadog agent by running datadog-agent status. This will give you all sorts of output on the configuration and status of your Datadog agent. Under the Collector section you should see the Varnish integration:
...
    ---------------
    varnish (2.1.0)
    ---------------
      Instance ID: varnish:6185659126b151a1 [OK]
      Configuration Source: file:/etc/datadog-agent/conf.d/varnish.d/conf.yaml
      Total Runs: 3
      Metric Samples: Last Run: 410, Total: 1,230
      Events: Last Run: 0, Total: 0
      Service Checks: Last Run: 1, Total: 3
      Average Execution Time : 112ms
      Last Execution Date : 2024-04-17 17:27:25 UTC (1713374845000)
      Last Successful Execution Date : 2024-04-17 17:27:25 UTC (1713374845000)
...
Logging
The previous snippet mentions varnishncsa.log, which is the default log file used by the varnishncsa service. Activate it with:
systemctl restart varnishncsa
Checking it all works
Make sure you send a few requests to Varnish first so you have some logs and counters to look at.
Metrics
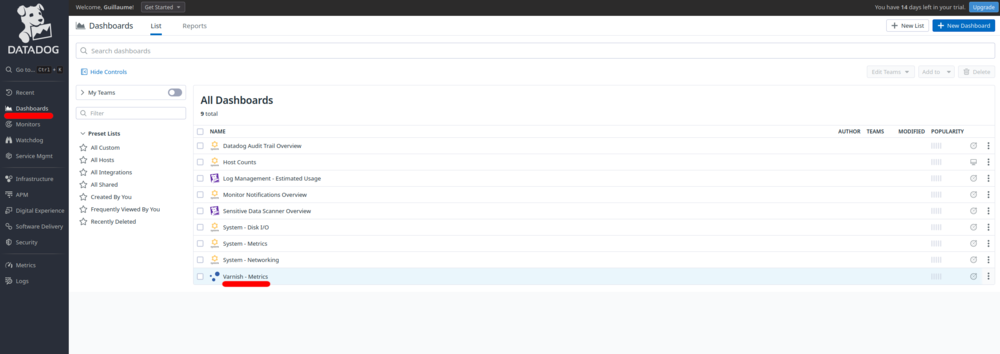
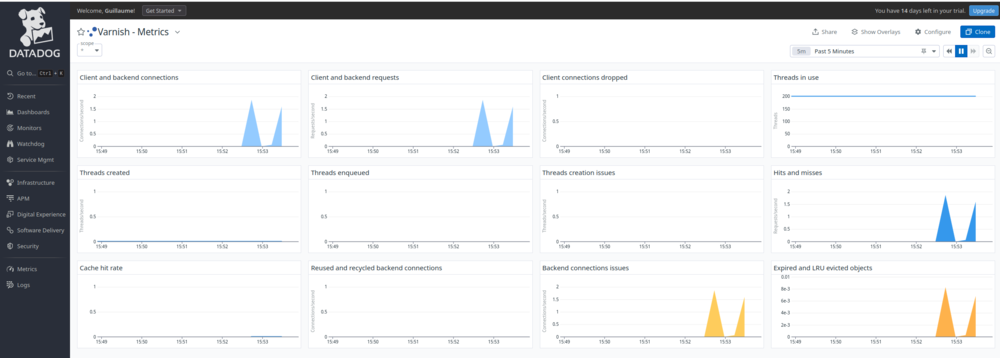
In the Datadog UI, if you click on the Dashboards section, there will now be a pre-made Varnish dashboard with some basic metrics.
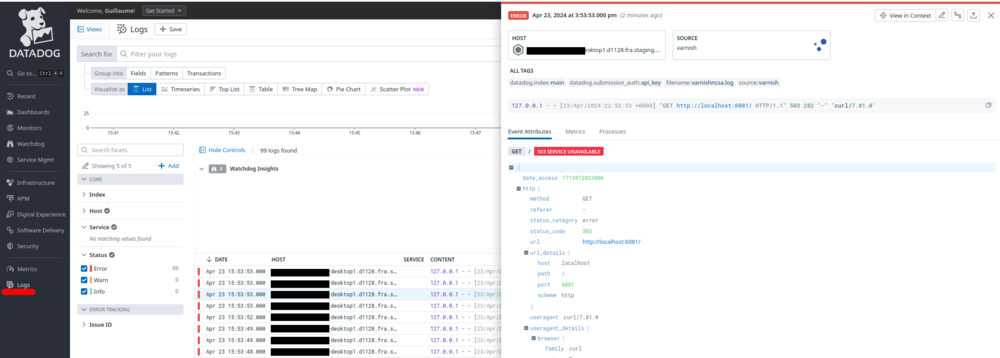
Logs
Click on Logs in the left side menu, you should immediately see logs, as show in the picture. Logs are automatically parsed (thanks to the ncsa format) and you can filter them using the query bar at the top.